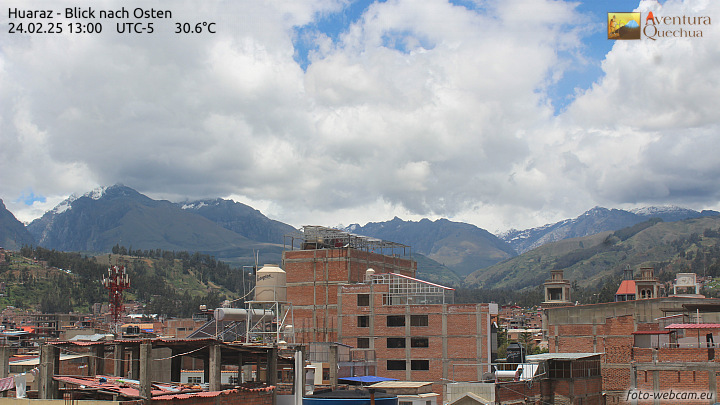
Live webcam
 Click on the picture for more!
Live agro-meteorological data at Llupa
Time is in local time (UTC-5h).
 Interactive version available here.
Data available for download on acinn-data.
Precipitation along the Huaraz transect
In the plots below the stations are ordered from west to east: see the map in Study Region for the location of the sensors.
14-days average precipitation at each station, clearly displaying the occurrence of dry and wet spells during the rainy season.
Daily cycle of precipitation for all periods without data gaps, displaying a clear cycle as well a significant differences along the transect.
Data available for download on acinn-data.