In the process of proposal writing we had to remove a few analyzes that, although interesting, didn’t make it to the final proposal for reasons of space. Since I like them a lot, I thought I would share them here.
The first graphic shows a map of the annual rainfall (mm yr-1) averaged for the period 1998-2009. These are precipitation estimates, i.e. not directly measured but inferred from satellite data. The climatologies are provided at ~5km resolution by Bookhagen & Strecker (2008).
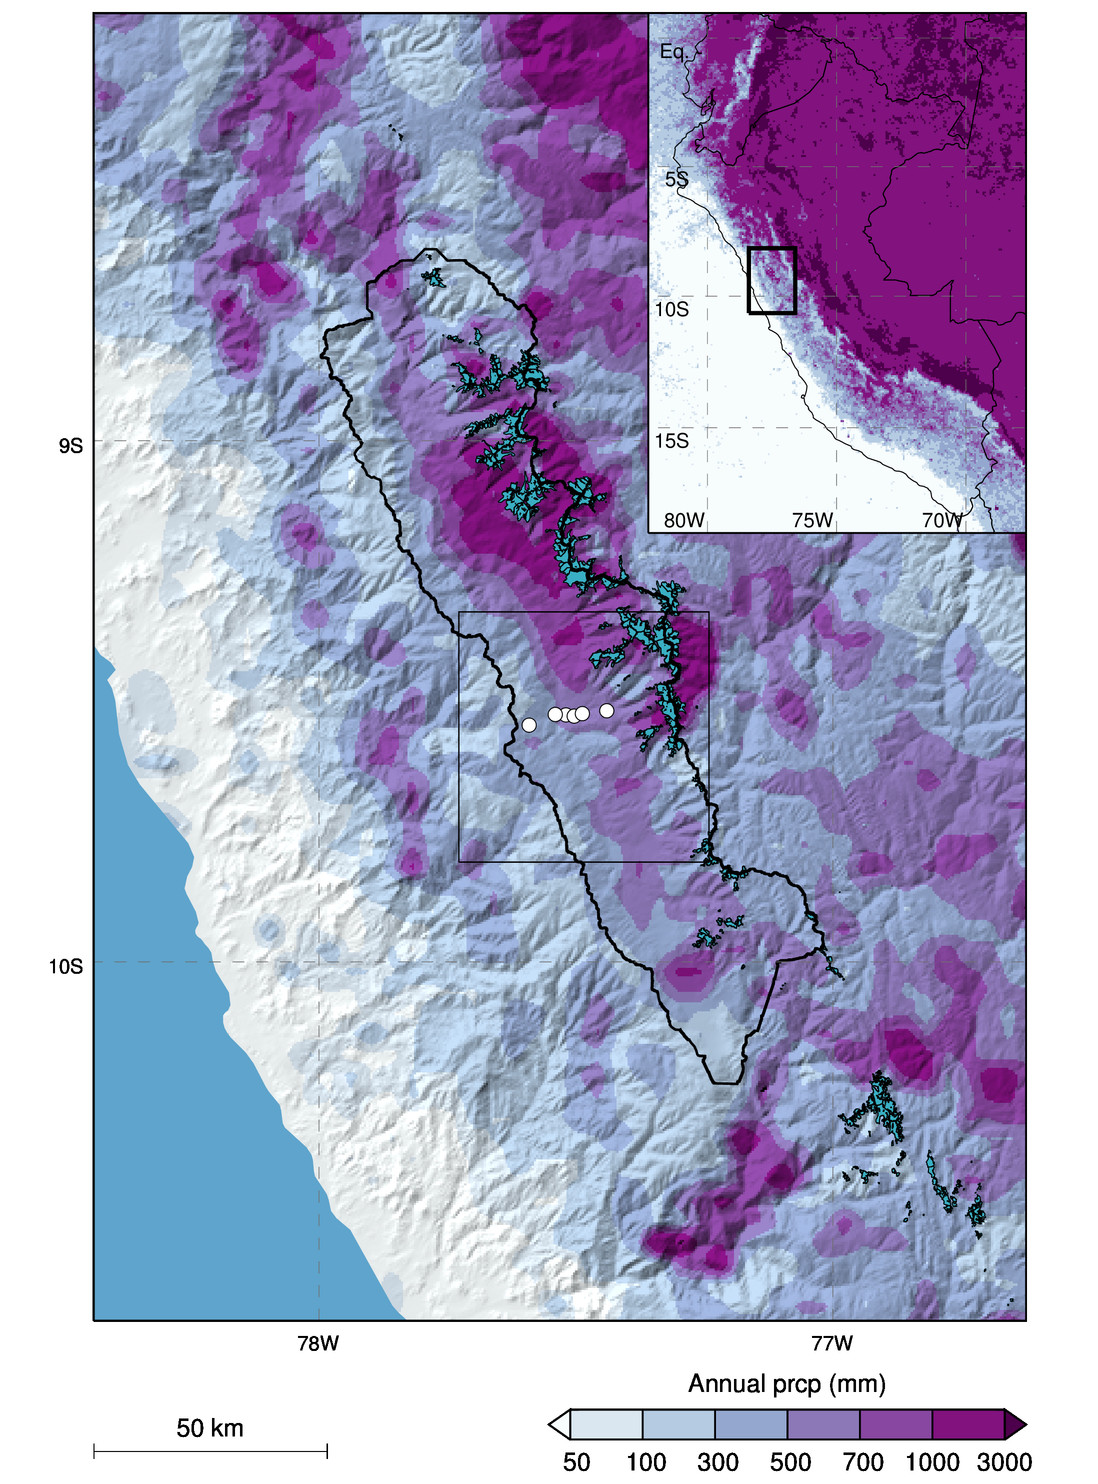 Precipitation in the Huaraz Region as seen by TRMM. Graphic: F. Maussion.
TRMM data: Bookhagen & Strecker (2008).
Glacier outlines: RGI.
Precipitation in the Huaraz Region as seen by TRMM. Graphic: F. Maussion.
TRMM data: Bookhagen & Strecker (2008).
Glacier outlines: RGI.
This graphic tells us a lot. First, it shows the very large gradient of precipitation between the wet amazonian basin (> 3000 mm precipitation per year) and the very dry Pacific coast (< 50 mm per year). Then, it demonstrates the strong influence of orography on the precipitation patterns, with high mountain ridges receiving more precipitation than the low lying valleys. This is a well known process, but the exact patterns and physical mechanisms vary from one mountain range to another. Finding out what’s going on in our region in particular will be one of the goals of our research project. Finally, one can see that there is also a gradient along our transect: the Cordillera Negra (“black”, i.e. no snow or glaciers) in the west appears dryer than the Cordillera Blanca (“white”) in the east. This is confirmed by our preliminary observations along the transect.
The second graphic shows a map of the temporal correlation (r) of each grid point’s monthly precipitation timeseries with the Huaraz grid point timeseries as reference. The data, obtained from the TRMM V7 gridded precipitation data at ~27km resolution is coarser than above but has a temporal resolution of 1 month and covers the period 1998-2014.
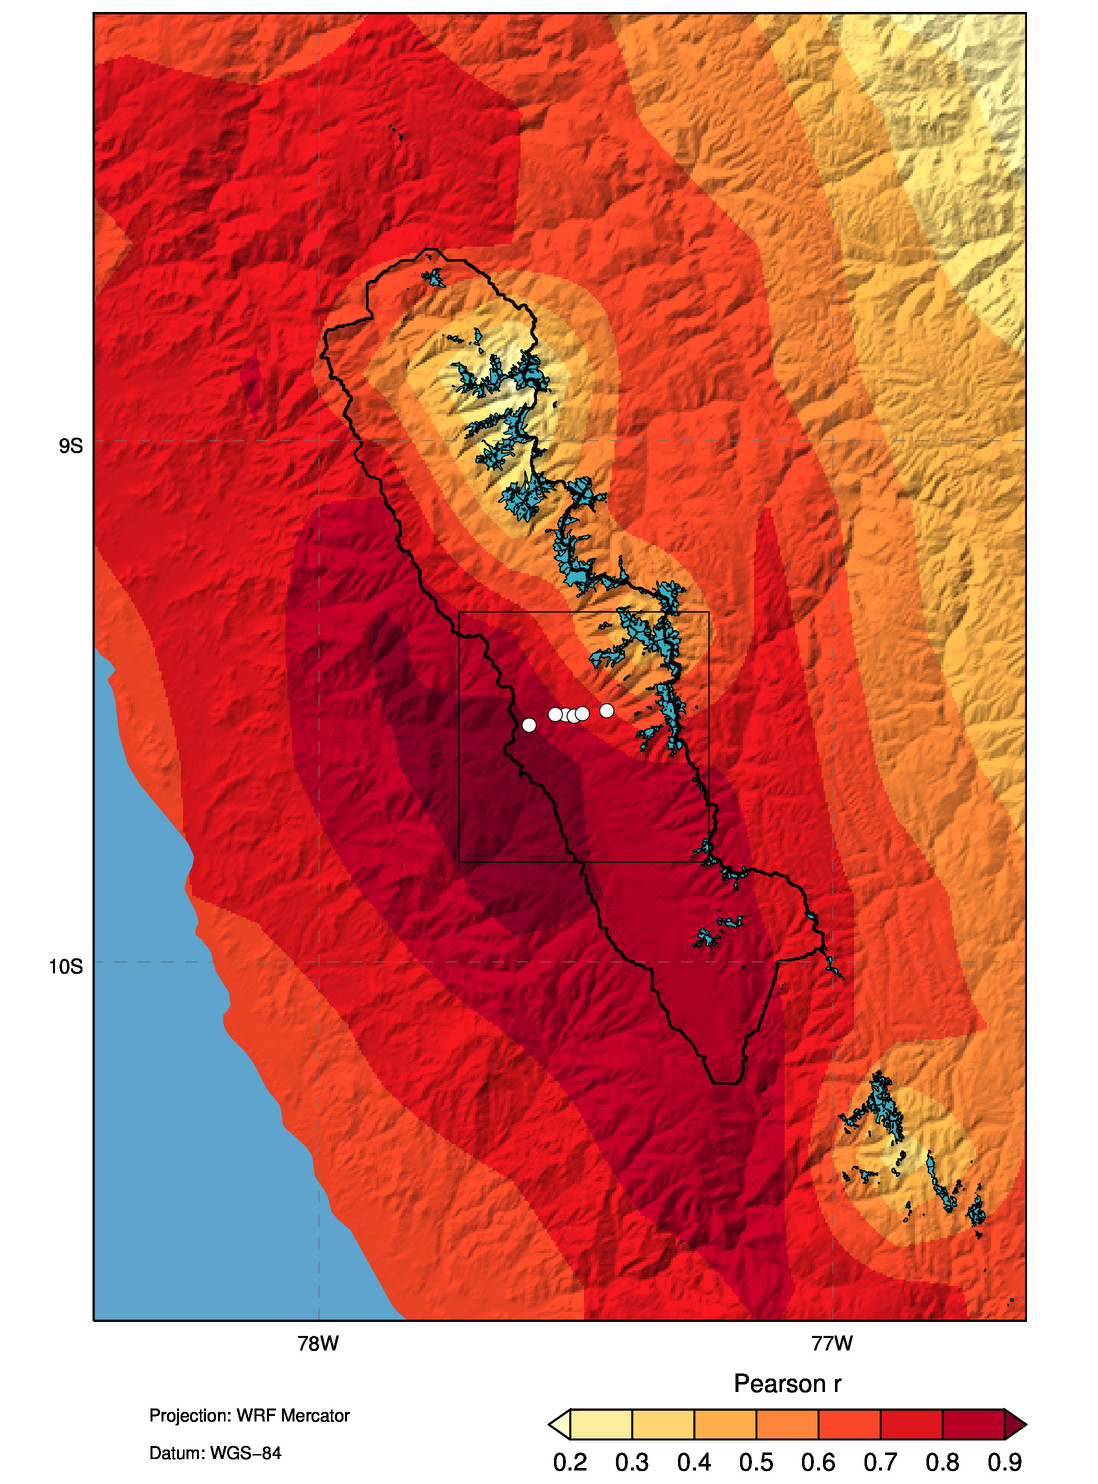 Precipitation temporal variability as seen by TRMM. Graphic: F. Maussion.
TRMM data: NASA.
Glacier outlines: RGI.
Precipitation temporal variability as seen by TRMM. Graphic: F. Maussion.
TRMM data: NASA.
Glacier outlines: RGI.
A high value indicates that this location’s monthly precipitation varies similarly to the reference location, here on the west of Huaraz. A striking feature of this map is the very low correlation between the Cordillera Negra and Blanca precipitation, in particular the higher, northern part. Along the transect, the correlation also switches from high to low values, which is indicating that certain wet spells or droughts might happen on one side of the valley but not on others on certain years. This has yet to be confirmed (or not!) by our observations, which cover only two seasons.
While these data are very valuable, they are of coarse resolution and have large uncertainties: in our project, we will produce a new high-resolution precipitation and climate dataset to fill these gaps in knowledge and data availability.